Evaluating missingness assumptions for items in a frailty index
SER: June 14, 2023
Department of Health Sciences
The Roux Institute
Northeastern University
Context: deficit-accumulation frailty index
Frailty is a syndrome of vulnerability more common in older adults
A frailty index is a quantitative measure of the aggregate burden of age-related health deficits

FI = # of deficits / # of possible deficits
![]()
- Large-scale NIH study to gather health data from 1 million+ Americans
- Focus on those underrepresented in biomedical research
- Multimodal data collection includes surveys, electronic health records, biospecimens, and more
Shiny app to elicit parameters
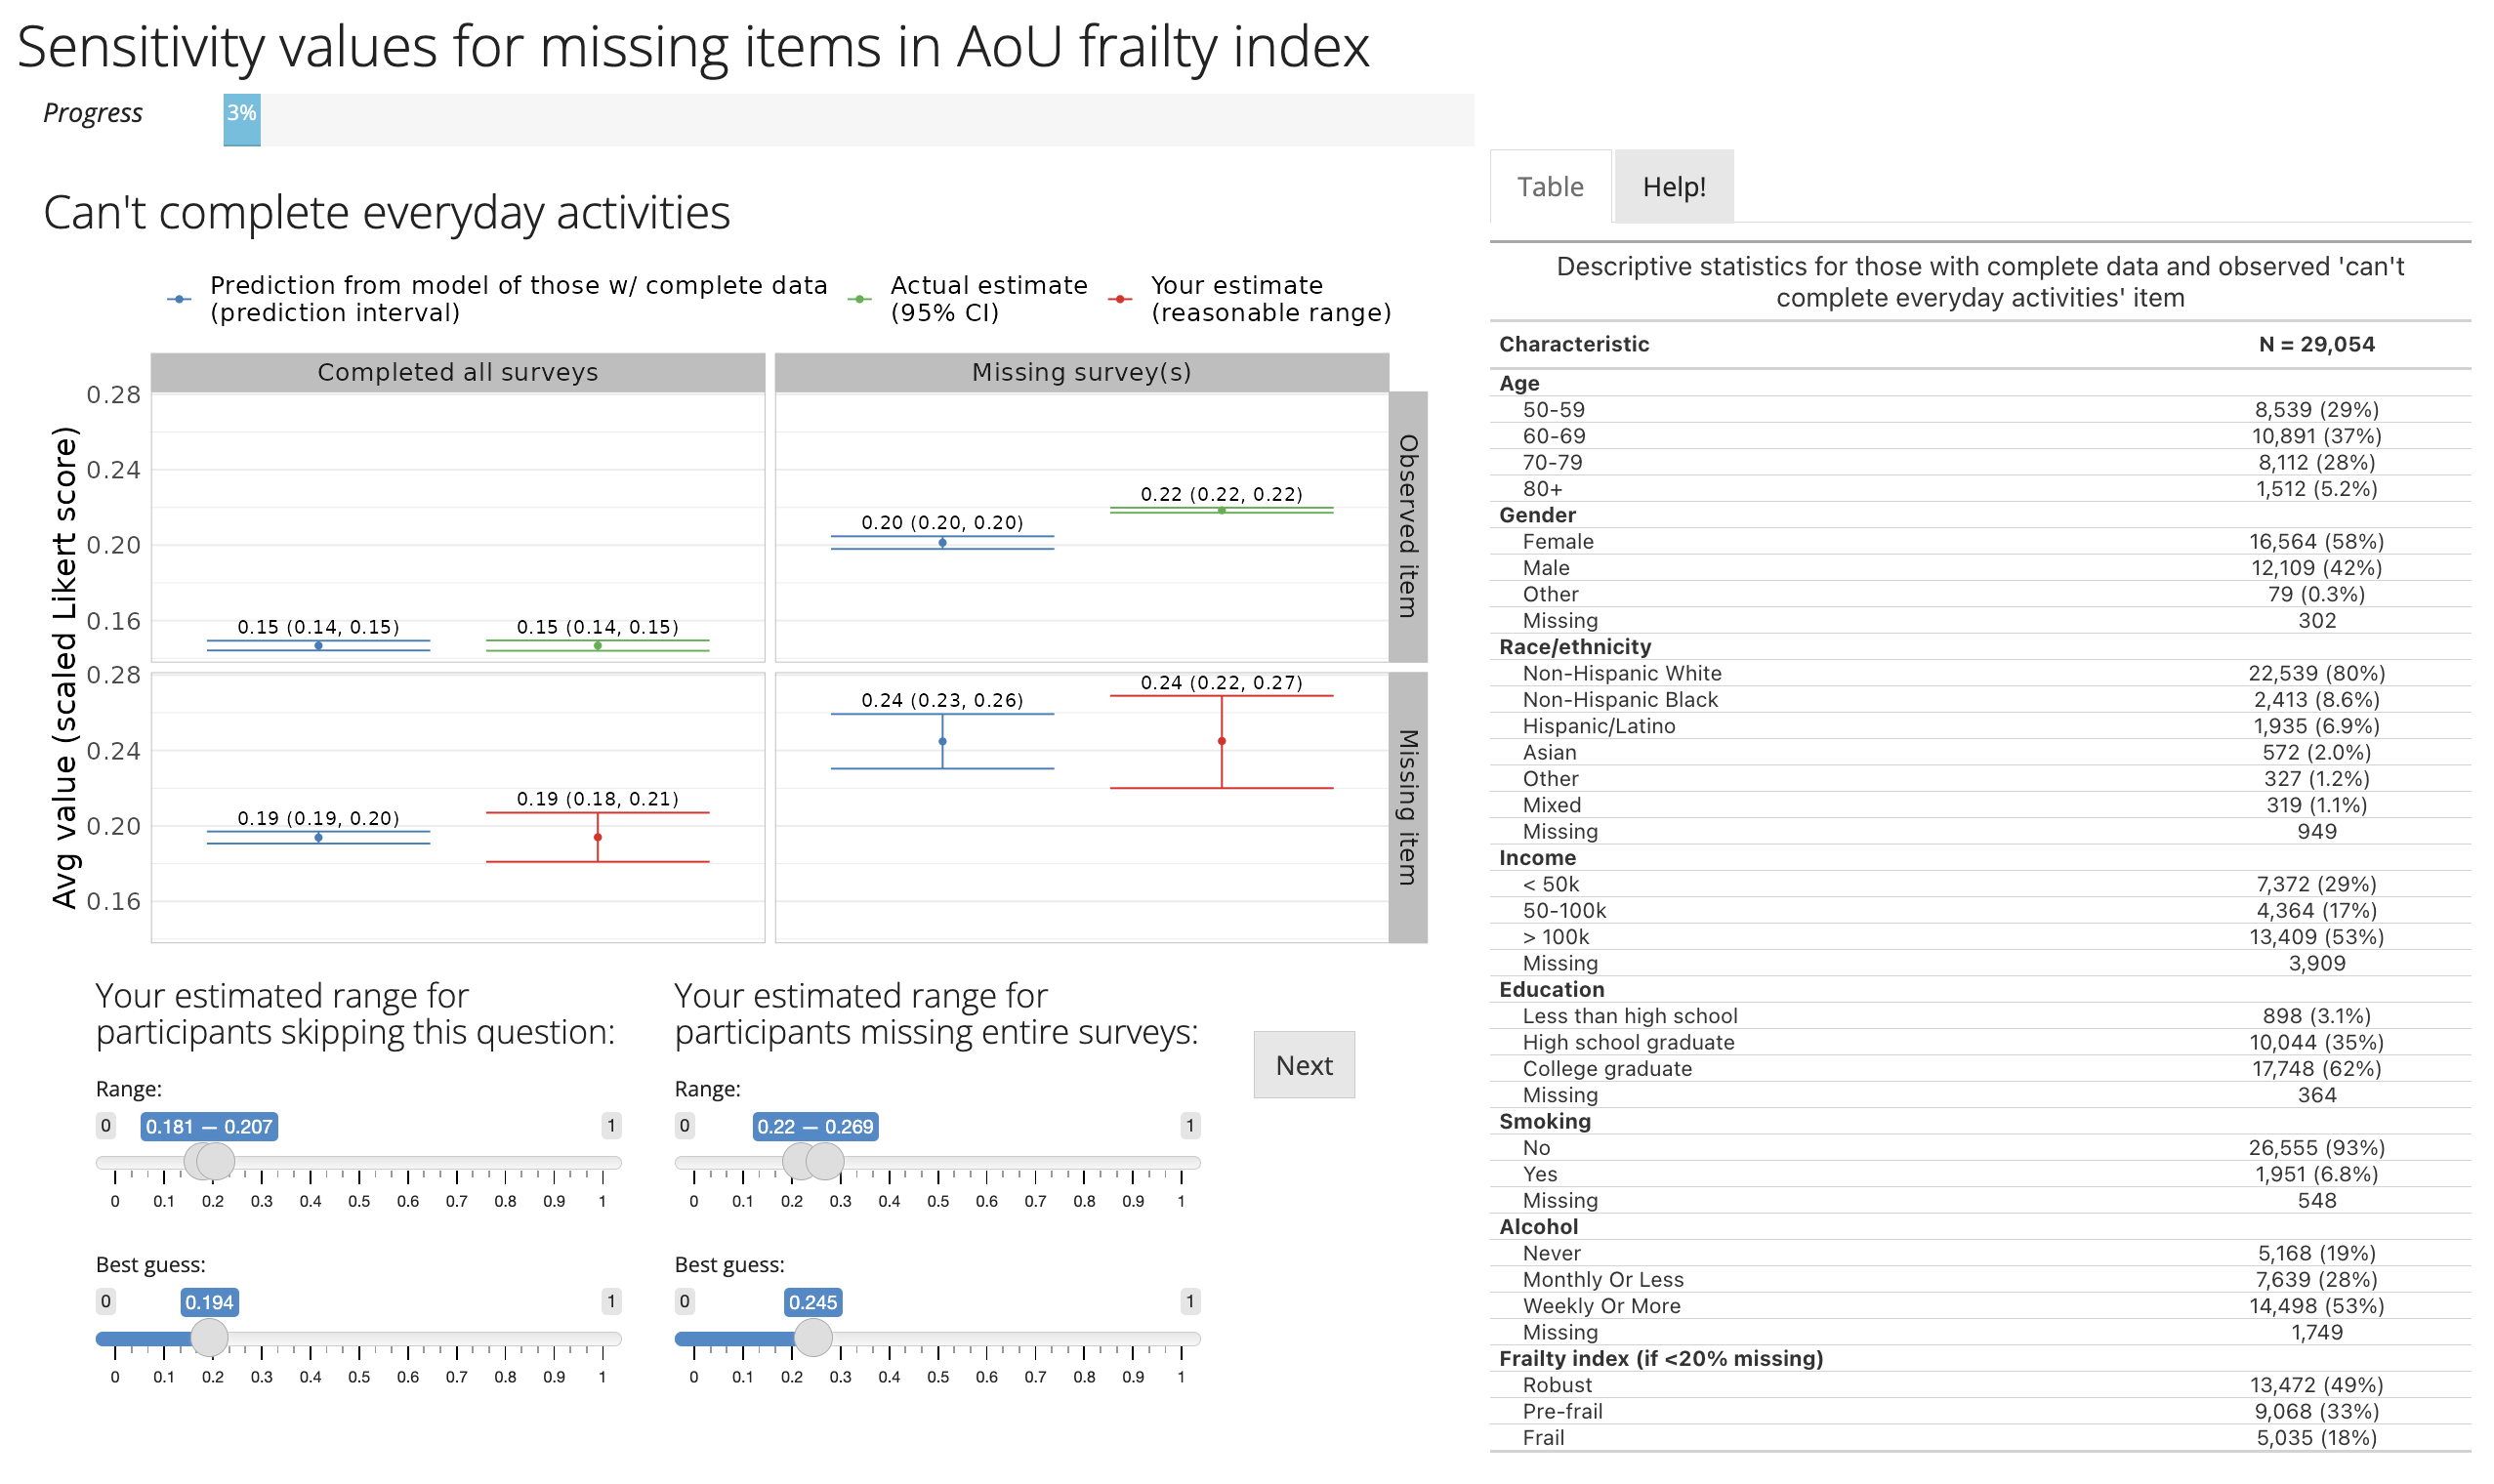
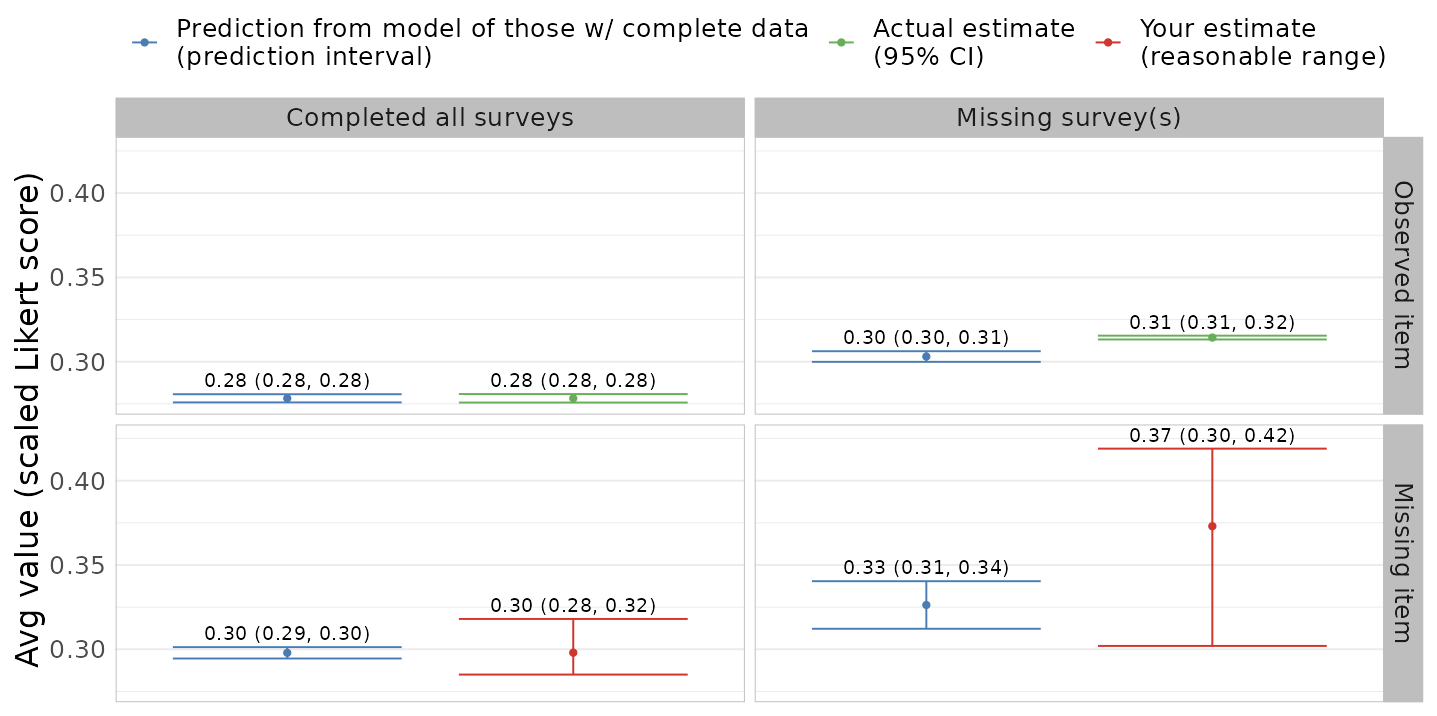
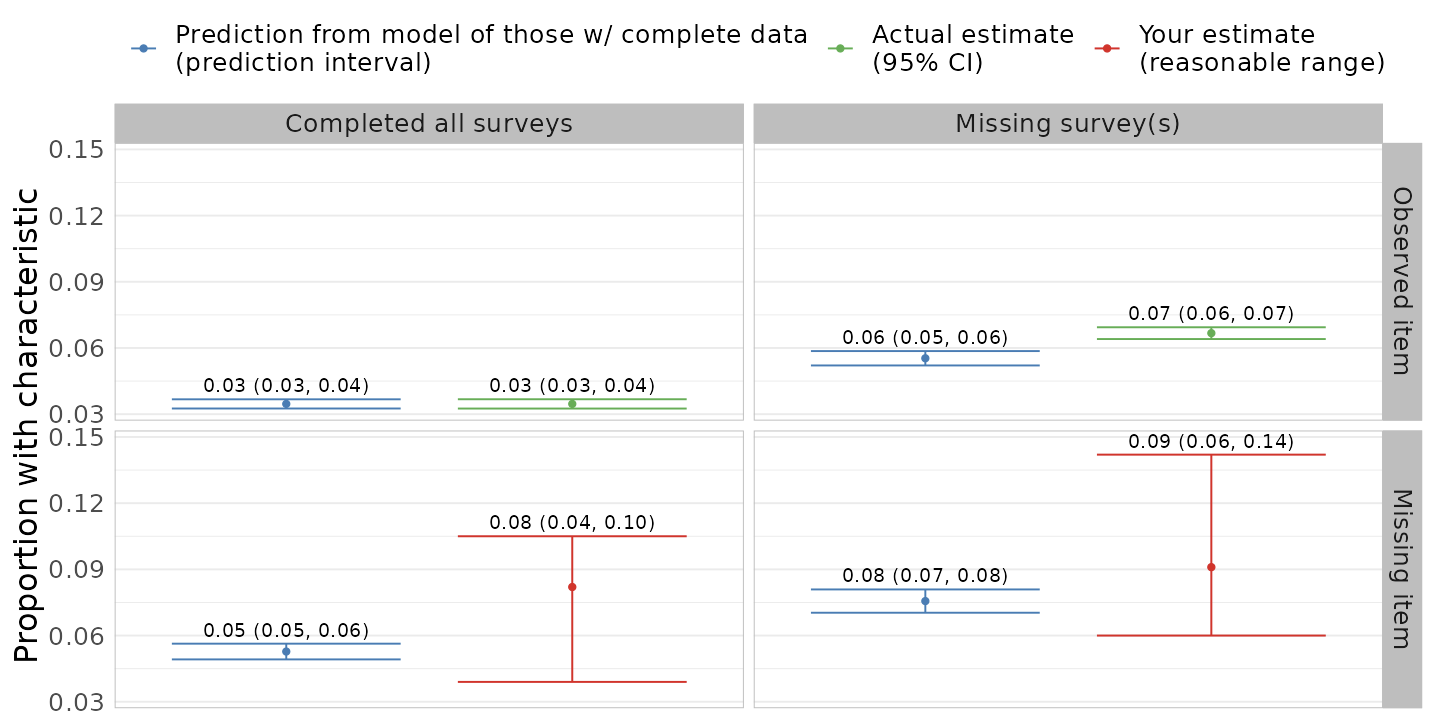
Standardized means
- Fit a model for item among participants with complete data (group A), conditional on demographics, etc.
- Predict item prevalence among participants with other missing surveys, but complete item of interest (group B)
- Compare observed and predicted item prevalence in group B: differences are not accounted by demographics, instead by missing data pattern
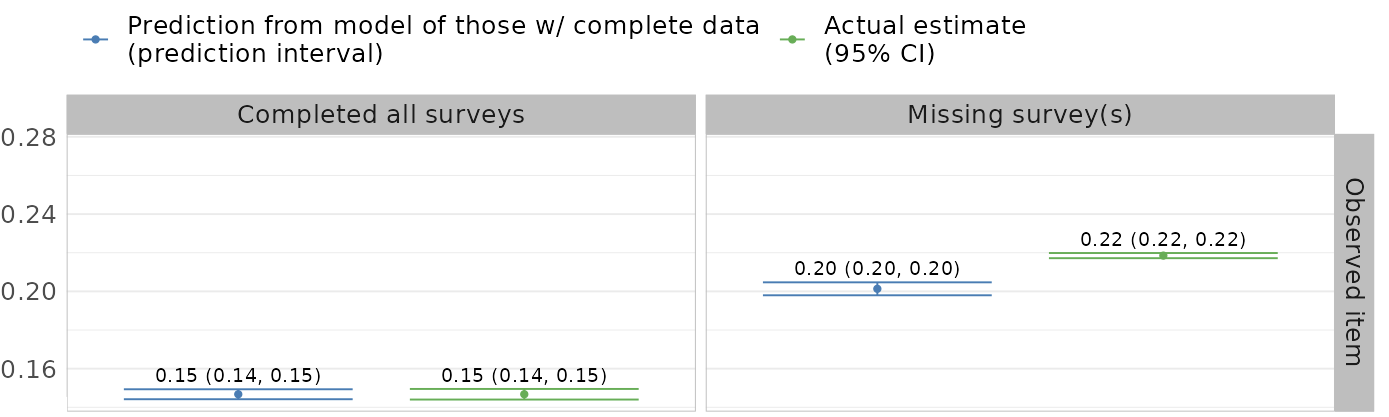
This comparison makes specifying the sensitivity parameters more concrete
Experts in this population can combine with their knowledge
Shiny app to elicit parameters
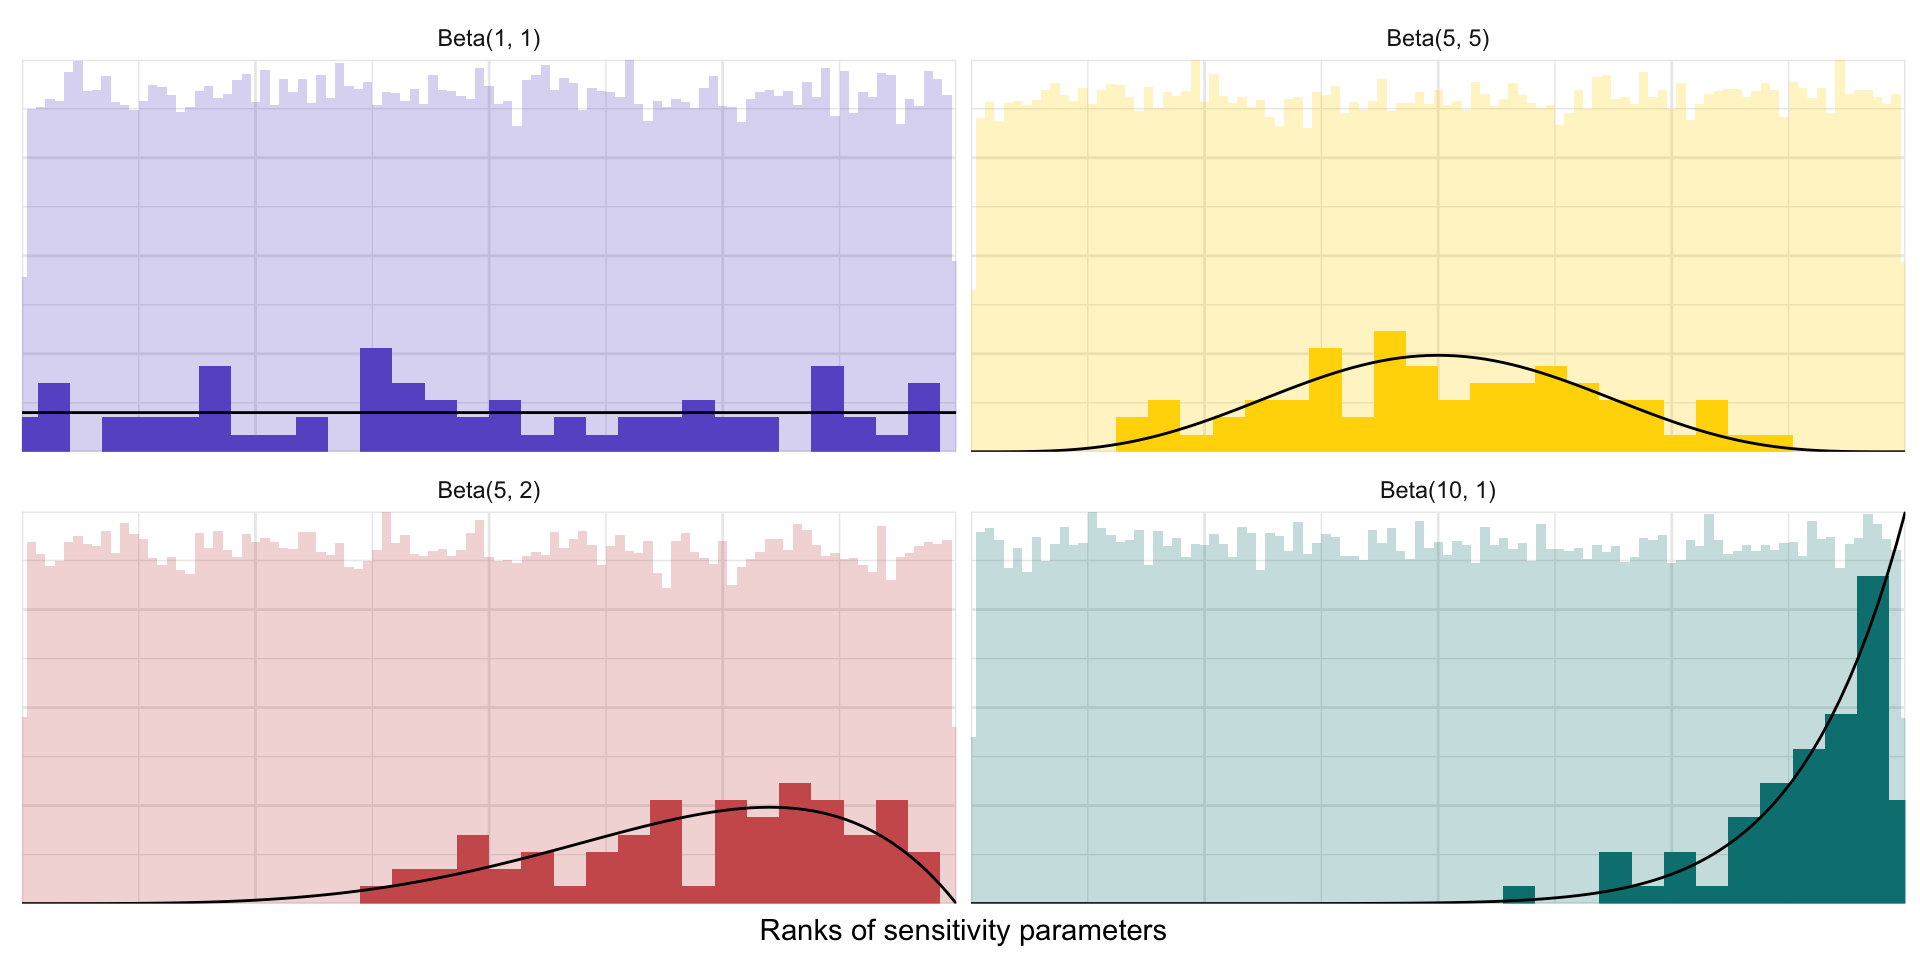
Distributions of sensitivity parameters
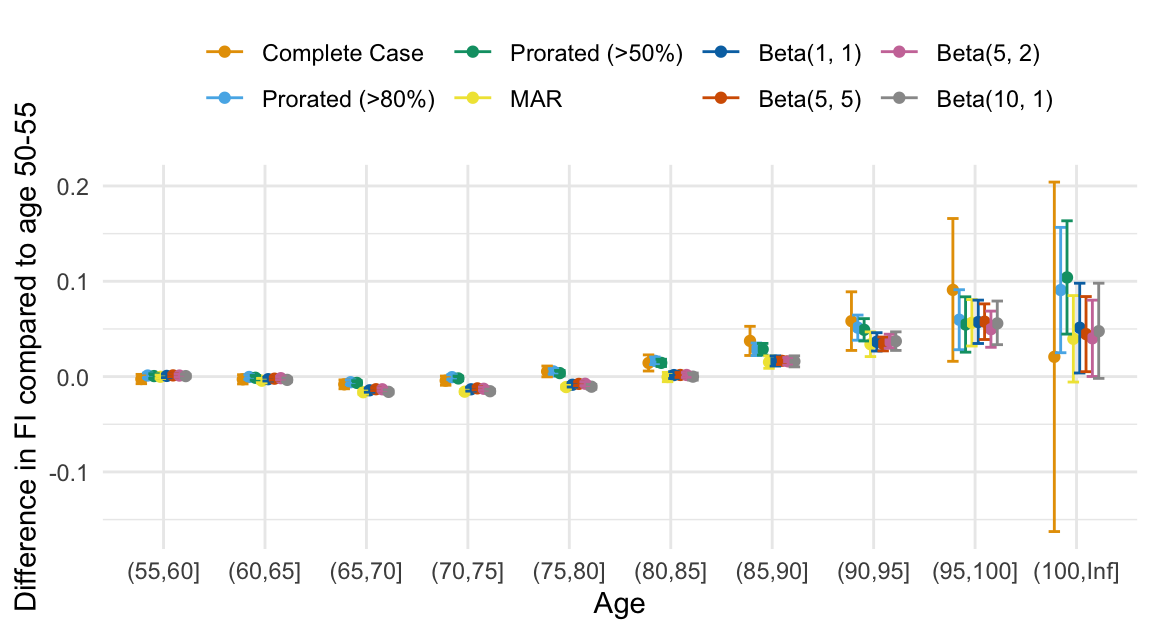
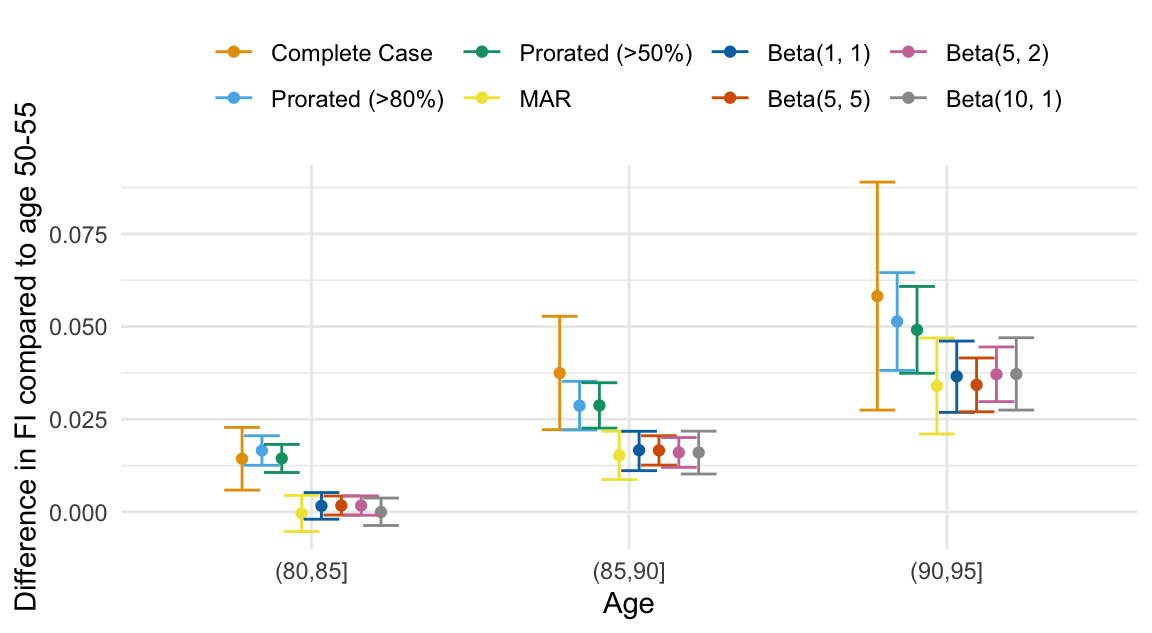
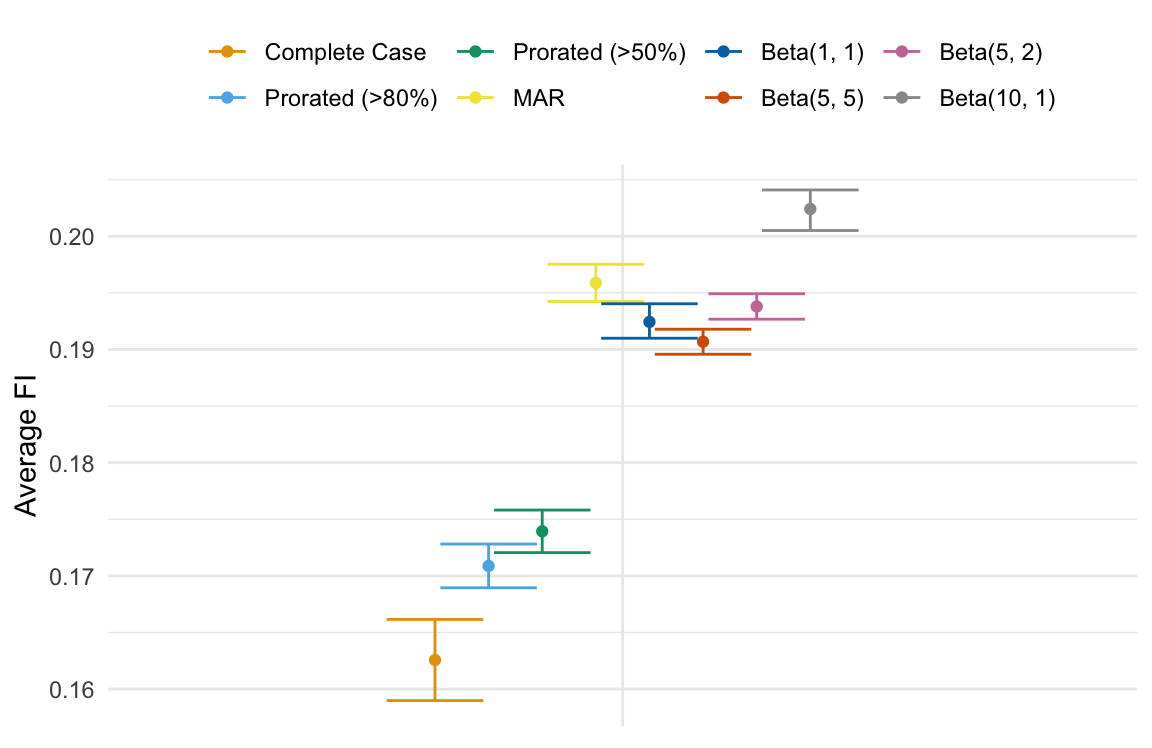
Average FI age 50-55
Age differences in FI